Geometry Optimization
The problem
After optimizing the geometry of a molecular system or lanthanide complex and verifying that the norm of the gradient has been sufficiently reduced, users tend to be satisfied with the geometry obtained and proceed to compute other properties.
Is this warranted?
No!
Actually it is very important to determine if this geometry corresponds to a true minimum in the potential energy hypersurface where the atoms move.
How?
The solution
By carrying out a FORCE calculation after having minimized the geometry and verifying that there are no negative force constants.
And what if there are negative force constants?
Then you must eliminate them, by carrying out IRC calculations and displacing the geometry in either direction of the corresponding normal coordinate.
Subsequently, at the displaced geometries, you reoptimize them; carry out a FORCE calculation again; and repeat this cycle until you no longer have any negative force constants.
This process is thoroughly explained in the tutorial below.
Background
When one optimizes the geometry of a molecular system, such as a lanthanide complex, MOPAC will attempt to reduce the gradient norm. For lanthanide complexes, we normally recommend stopping the geometry optimization when the gradient norm becomes smaller than 0.25 kcal/Ångstrom, via the keyword GNORM=0.25.
However, the simple zeroing of the gradient norm does not guarantee that the corresponding geometry is stable; that it is at a true energy minimum.
To clarify this point, let us consider the equivalent problem in one dimension, when the gradient is the function derivative.
As is well known, when the derivative of a one-variable function is zero, that does not automatically mean that the function is at a minimum. It simply means that the derivative is zero, and that could be one of three situations: the function could be at a minimum, at a maximum, or at an inflection point, as shown below.

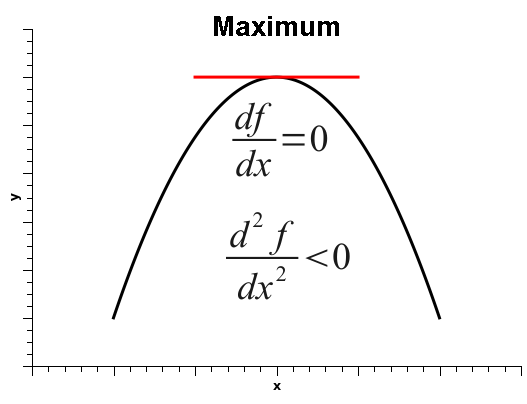

Thus, in order to decide among the three situations, one must calculate the second derivative, which is positive if the function is at a minimum, negative at a maximum, or zero, at either a flat surface or an inflection point.
In a molecular system, such as a lanthanide complex, with N atoms, there are 3 Cartesian coordinates per atom, for a total of 3N Cartesian coordinates.
The movements of the atoms, within the linear approximation, can be decoupled via diagonalization of the Hessian matrix, by a unitary transformation of the Cartesian coordinates into a new set of coordinates called normal coordinates. The normal coordinates are linear combinations of the Cartesian coordinates of the atoms, and correspond to molecular vibrations, rotations and translations.
Of the 3N normal coordinates, 3 correspond to translations of the whole molecular system or lanthanide complex along the directions x, y, and z.
For a linear molecule, two other normal coordinates correspond to rotations of the whole molecular system or lanthanide complex along the main axis of symmetry, whereas for nonlinear molecules there are three other normal coordinates corresponding to rotations.
The remaining normal coordinates correspond to vibrations.
As such, for linear molecules there are 3N-2 vibrations, and for nonlinear molecules, there are 3N-3 vibrations.
The second derivatives of the energy with respect to each normal coordinate give the force constants. Thus, if the gradient norm is zero and the force constant is positive (for a given normal coordinate), the geometry is at a true minimum with respect to that normal coordinate.
On the other hand, if the gradient norm is zero and the force constant is negative for a given normal coordinate, the geometry is at a maximum with respect to that normal coordinate.
Finally, if the gradient norm is zero and the force constant is also zero, either the normal coordinate is at an inflection point, or it is lying on a flat surface. And such is the case for translations and rotations.

Indeed, since there are no impediments to translations or rotations, the force constants correponding to these movements should be zero.
As an example, below we represent the three normal coordinates for the translations of the flat molecule of LuBr3, where the blue arrows indicate the directions of the movements of each atom along the corresponding normal coordinate.

And below, we also represent the normal coordinates corresponding to the three rotations of the same molecule.

On the other hand, there are internal forces in every molecular system or lanthanide complex, and, therefore, the force constants corresponding to vibrations are not zero.
Below, we present three of the six normal coordinates of LuBr3 corresponding to vibrations.

The vibrational frequencies, measured by infrared or Raman spectroscopy are proportional to the square root of the force constants.
So, when one of the vibrational force constants is negative, the corresponding vibrational frequency is imaginary.
A valid optimized geometry must have all vibrational force constants positive, in which case one can safely say that the geometry is sitting at a true minimum at the potential energy hypersurface.
Tutorial
Is the optimized geometry a true minimum?
As a case study, let us consider complex OGIJAP [aqua-bis(nitrilotriacetato-N,O,O',O'')-holmium(iii)] below:
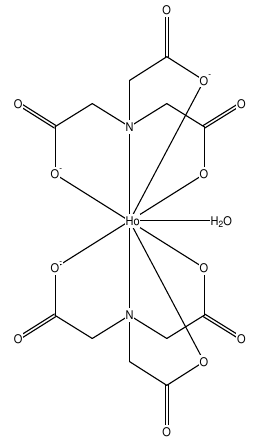
In GABEDIT, we drew its structure, and then run MOPAC to optimize the geometry. We then optimized the geometry.
The output looks normal, as shown below.
 CYCLE:   218 TIME:   0.053 TIME LEFT:  2.00D  GRAD.:     0.255 HEAT: -684.9659
 CYCLE:   219 TIME:   0.053 TIME LEFT:  2.00D  GRAD.:     0.256 HEAT: -684.9659
 CYCLE:   220 TIME:   0.052 TIME LEFT:  2.00D  GRAD.:     0.270 HEAT: -684.9659
 CYCLE:   221 TIME:   0.054 TIME LEFT:  2.00D  GRAD.:     0.282 HEAT: -684.9660
 CYCLE:   222 TIME:   0.056 TIME LEFT:  2.00D  GRAD.:     0.321 HEAT: -684.9661
 TEST ON GRADIENT SATISFIED
PETERS TEST SATISFIED

 -------------------------------------------------------------------------------
PM6 SPARKLE XYZ AUX GNORM=0.25 BFGS CHARGE=-3 Singlet

 Mopac file generated by Gabedit


     PETERS TEST WAS SATISFIED IN BFGS OPTIMIZATION
     SCF FIELD WAS ACHIEVED
As such, in principle one would not suspect that there is anything wrong with the geometry, nor by the output above, neither by looking at a picture of the converged geometry (see below).
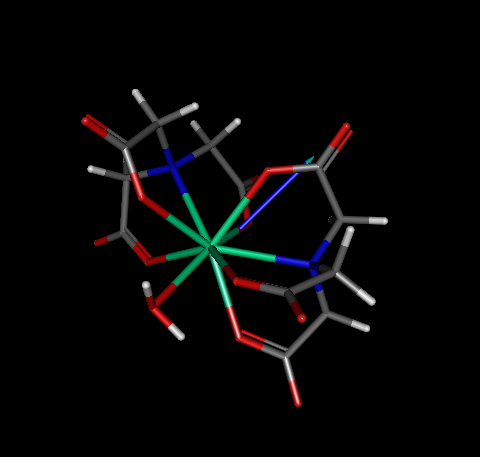
At this point, we must verify whether or not this geometry is a true minimum. Therefore, we need to run a FORCE calculation in order to check whether or not all force constants are positive. For convenience, we provide the .mop input file ogijap_opt_force.mop
As a result of the MOPAC calculation, two output files are produced: ogijap_opt_force.out and ogijap_opt_force.aux. The .aux file contains all force constants, including translations and rotations. On the other hand, the .out file shows only the vibrations.
Here is a sample of the .aux file for this calculation:
 ####################################
 #                                  #
 #      Normal mode analysis        #
 #                                  #
 ####################################
 ROTAT_CONSTS:CM(-1)[3]=     0.007339     0.004886     0.004735
 PRI_MOM_OF_I:10**(-40)*GRAM-CM**2[3]  3814.203258  5729.543526  5911.848790
 ZERO_POINT_ENERGY:KCAL/MOL=   172.113781
 VIB._FREQ:CM(-1)[0126]=
  -139.72    36.84    46.29    56.84    59.40    64.38    79.30    82.57   117.29   119.35
   127.31   137.39   155.41   168.66   179.52   187.85   194.90   202.94   213.81   250.49
   273.24   285.42   288.57   299.52   307.42   313.25   326.83   335.42   344.27   351.61
   380.88   389.69   394.38   403.56   421.56   443.92   481.39   487.52   531.96   537.37
   541.75   548.57   556.87   580.86   588.39   623.44   626.16   637.05   639.00   694.95
   697.80   709.55   714.79   727.07   730.10   773.33   885.18   939.80   943.25   950.85
   956.68   963.23   969.19   990.60   994.31  1024.13  1026.79  1027.89  1031.55  1078.07
  1081.06  1102.59  1104.51  1127.39  1128.34  1152.63  1153.53  1221.08  1221.33  1236.90
  1238.89  1251.49  1253.09  1265.49  1267.18  1272.07  1275.72  1295.58  1296.52  1325.93
  1330.48  1337.18  1339.65  1361.21  1373.99  1376.52  1384.17  1415.56  1422.62  1429.82
  1773.40  1779.17  1792.04  1796.08  1803.07  1839.70  2423.60  2550.13  2649.68  2650.10
  2658.51  2661.38  2665.12  2667.64  2727.41  2729.27  2732.51  2733.83  2734.50  2736.18
     0.10     0.11     0.11    12.34     8.45     8.72
Please, note that the last six frequencies are close to zero, and they represent the rotations and translations. All the other frequencies correspond to vibrations, and are all positive, except the first one. Indeed, there appeared a negative frequency: -139.72. Actually it is not really negative - its is an imaginary frequency due to a negative force constant. The output shows it as negative instead of indicating it as imaginary, because it is much simpler to print the result that way.
So, we have a problem: an imaginary frequency appeared!
But before we go solve this problem, let us examine the corresponding output: the .out file.
          HEAT OF FORMATION =    -682.326855 KCALS/MOLE

          ZERO POINT ENERGY     172.114 KCAL/MOL

         NOTE: SYSTEM IS NOT A GROUND STATE, THEREFORE ZERO POINT
         ENERGY IS NOT MEANINGFULL. ZERO POINT ENERGY PRINTED
         DOES NOT INCLUDE THE  1 IMAGINARY FREQUENCIES


           NORMAL COORDINATE ANALYSIS (Total motion = 1 Angstrom)


   Root No.       1         2         3         4         5         6         7         8

                 1 A       2 A       3 A       4 A       5 A       6 A       7 A       8 A

                -139.7      36.8      46.3      56.8      59.4      64.4      79.3      82.6

           1    0.0039   -0.0305    0.0116   -0.0027    0.0200   -0.0099   -0.0022   -0.0013
           2   -0.0038    0.0183   -0.0042   -0.0045   -0.0172   -0.0087    0.0052   -0.0139
           3    0.0009   -0.0230   -0.0170    0.0016   -0.0388    0.0694   -0.0286    0.0577
           4    0.0041   -0.0303    0.0105   -0.0030    0.0174   -0.0065   -0.0022    0.0013
The .out file has a different format. It shows columns containing the frequencies on top and, underneath, the coefficientes of the normal coordinates for each of the atoms cartesian x, y, z coordinates. Note that the output recognizes the presence of the imaginary frequency and identifies the system as not being a ground state.
One could not have known that without running the FORCE calculation.
So this geometry is not a true minimum.
Since this geometry has one imaginary frequency, it is actually sitting on top of a maximum in the energy hypersurface.
In order to remove it, we must distort the geometry in either direcion of the corresponding normal coordinate.
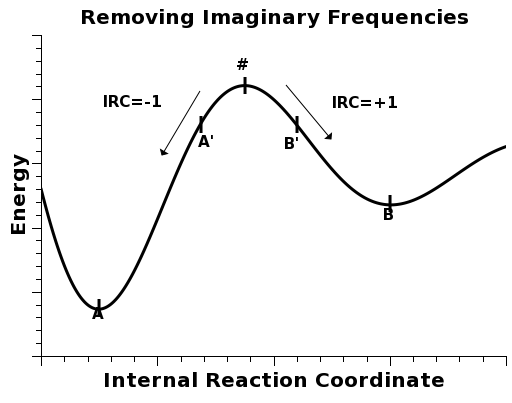
In order to run an IRC calculation and tell MOPAC to distort the geometry to either side of the maximum, we must use the keyword IRC=1* .
Even if there are more than one imaginary frequency, one should always distort the geometry in both directions of the normal coordinate of the first imaginary frequency, which is always the most negative of all. This way, there is a good chance that by eliminating the first, one may also end up eliminating other imaginary frequencies at the same time.
For convenience, we provide the corresponding input .mop file ogijap_IRC.mop.
After running the calculation, a .xyz file is created. It contains a series of geometries distorted to either side of the maximum. For our purposes, we pick the first and the last ones, and ignore the others. These will correspond to geometries A' and B' in the figure above.
For convenience, we provide files ogijap_IRC.xyz.zip, ogijap_a_prime.mop and ogijap_b_prime.mop.
Then, we reoptimize both A' and B' geometries. We examine the corresponding .out files and pick the one with the smallest value for the heat of formation.
In this case, the A' geometry led to the lowest energy A geometry ogijap_a_prime.arc.
By running a FORCE calculation again on the A geometry, we verify that there are no more imaginary frequencies.
Here is a sample of the .aux file for this calculation:
 ####################################
 #                                  #
 #      Normal mode analysis        #
 #                                  #
 ####################################
 ROTAT_CONSTS:CM(-1)[3]=     0.007260     0.004894     0.004779
 PRI_MOM_OF_I:10**(-40)*GRAM-CM**2[3]  3856.008931  5719.576917  5857.754348
 ZERO_POINT_ENERGY:KCAL/MOL=   171.925970
 VIB._FREQ:CM(-1)[0126]=
    32.25    43.64    45.49    53.83    64.02    78.91    82.84   111.56   114.79   123.61
   130.95   151.59   158.35   169.72   184.01   190.83   195.00   207.94   225.48   246.04
   269.12   287.39   297.56   305.35   309.60   316.55   333.53   342.68   348.81   360.25
   384.31   389.21   398.23   404.29   423.67   448.90   494.01   497.95   516.66   527.39
   533.69   548.11   550.61   573.06   575.06   624.50   629.82   632.69   638.26   694.80
   697.56   707.99   713.54   726.23   727.73   783.30   867.08   938.77   943.64   951.71
   955.83   962.96   966.91   995.14  1004.32  1027.43  1029.93  1035.49  1039.64  1084.06
  1084.50  1101.81  1104.51  1135.05  1136.60  1146.61  1149.52  1223.06  1226.33  1239.87
  1242.14  1249.03  1250.47  1267.86  1269.31  1276.14  1276.79  1292.89  1295.65  1325.63
  1329.92  1341.57  1342.79  1374.73  1377.76  1382.03  1387.38  1395.79  1425.76  1429.94
  1771.76  1775.03  1789.46  1793.21  1800.34  1837.18  2274.16  2402.77  2637.86  2650.42
  2657.61  2659.51  2660.51  2663.07  2726.70  2728.11  2730.73  2731.54  2731.91  2734.50
     0.10     0.11     0.12    12.31     8.42     8.32
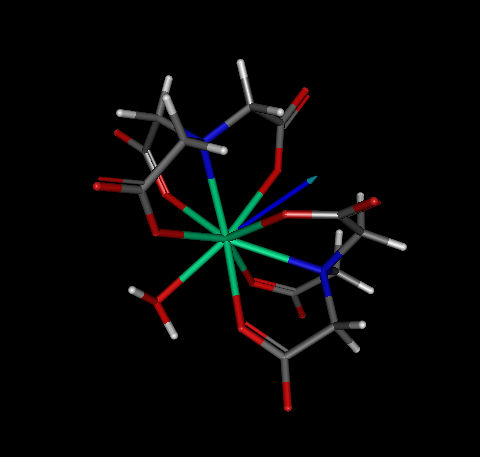
So, the A geometry of this complex, shown below, is thus verified to be at a true minimum.
The concept of a global minimum is easy to grasp. Please, consider the function below:
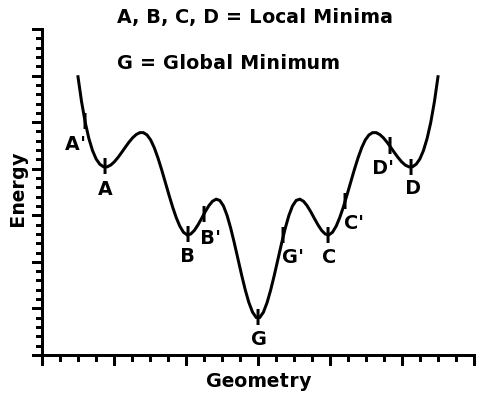
This function has five different minima: A, B, G, C, and D.
Four of them, A, B, C, and D, are called local minima because they are minima within a certain region around them.
However, one of the minima is the deepest of all: G. And that is why it is called the global minimum.
So, whenever one seeks to predict the geometry of a lanthanide complex, one must make sure that the found geometry likely corresponds to a true global minimum.
However, if one starts with a given geometry, MOPAC2012 will find the nearest minimum, which may be either a local minimum or the global minimum.
For example, in the figure above, if one starts from geometry A', the local minimum A will be found. Likewise, if one starts from geometry B', the local minimum B will be found, and so on...
So, how can one know that the global minimum has been found?
The answer is simple: one can never know for sure.
However, one can increase the probability that the global minimum will be found if one starts from many different geometries, and pick the optimized one with the lowest total energy.
For example, if one started from geometries A', B', G', C', and D', one would take note of the total energy of each optimized structure, A, B, G, C, and D, and pick the minimum G, which would be a good candidate for a global minimum - and indeed, in this figure, G is the global minimum.
The more geometries one starts from, the higher the likelihood that the global minimum will be found.
So, the solution is to generate as many starting geometries as possible, to guarantee a high probability of finding the geometry corresponding to the global minimum in the energy hypersurface.
Since the sparkle parameters have been fully optimized to reproduce the experimental crystallographic geometries of the lanthanide complexes, it is reasonable to assume that the best sparkle geometry will be the one which displays the least total energy possible: the global minimum in the complex geometry hypersurface of dimension 3N-6, where N is the number of atoms in the complex (assuming the complex is nonlinear).
This assumption has been tested and validated in:
Sparkle/PM3 Parameters for the Modeling of Neodymium(III), Promethium(III), and Samarium(III) Complexes
Ricardo O. Freire, Nivan B. da Costa, Jr., Gerd B. Rocha, and Alfredo M. Simas
J. Chem. Theory Comput., 2007, 3 (4), pp 1588–1596
Sparkle/PM3 for the Modeling of Europium(III), Gadolinium(III), and Terbium(III) Complexes
Ricardo O. Freire, Gerd B. Rocha and Alfredo M. Simas
J. Braz. Chem. Soc., Vol. 20, No. 9, 1638, 2009.
These references are, therefore, the required citations for using the technique described below.
To facilitate the generation of the starting geometries for a given lanthanide complex, we can create for you a tcl script to be used in Hyperchem. When you run this script in Hyperchem, the MOPAC input geometry files will be created. It is now just a matter of inserting the correct keywords and run MOPAC. When it all finishes, choose the optimized geometry which has the least total energy of all optimized structures.
Isolating and identifying the complexes' substructures
For this, it is necessary to gather some information about your lanthanide complex. For example, please consider the lanthanide complex below:

First, we need to know the number of ligands directly coordinated to the lanthanide ion.
To this number, please add 1, to account for the lanthanide ion. This final number is now the number of substructures in the complex.
For each substructure, we need to know which are the atoms directly coordinated to the lanthanide ion.
To isolate all substructures of the lanthanide complex, go to the tool bar and double click in the icon "Draw". Choose the element "Lone Pair" (which symbol is "Lp") and connect it to lanthanide ion, as in the figure below.
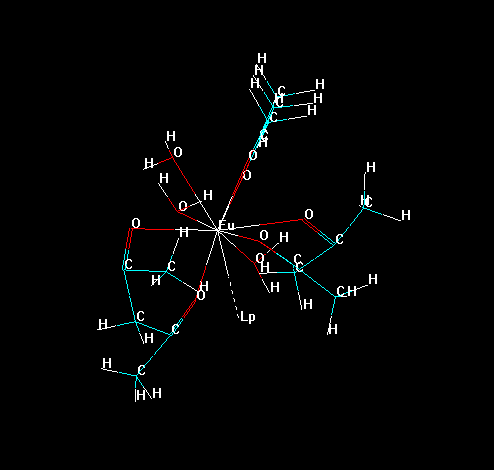
Now, erase all bonds of the ligands to the lanthanide ion, except the "bond" of the "Lone Pair" with the lanthanide ion, as in the figure below. This prevents the lanthanide ion to be deleted later in the process.
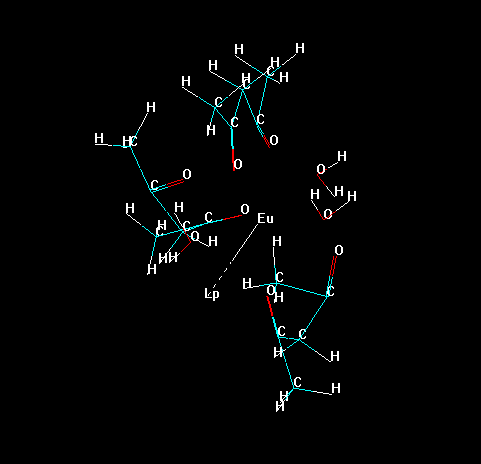
Please, notice that Hyperchem identifies each substructure by an identification number.
In the menu bar go to "Select" > "Molecules" and click on it.
Now, click on any substructure of the lanthanide complex, its number will appear on the bottom of the screen, as in the figure below.

Select the substructures one-by-one and take note of the identification number corresponding to each molecule. Please, include the lanthanide ion in your selection.
The atoms are also identified by HyperChem using an identification number.
In the menu bar, go to "Select" > "Atoms" and click.
Then, click on any atom directly connected to the lanthanide ion.
Select at least one atom on each substructure, and take note of its identification number and also the identification number of the substructure.
Now, save your lanthanide complex as a PDB file. Go to the menu bar, "File" > "Save As". Put a filename which you prefer, choose the filetype "Brookhaven PDB (*.PDB, *.ENT)". Important: in "PDB Options:" select "Hydrogens".
Now, save the file. Remember the name of this file.
Generating the Tcl Script
To generate the script complete the fields in the form below.
In the field "Number of substructures", type the number of substructures.
In the field "PDB file", type the filename and include the extension of this file.
In the field "Number of conformations", type the number of conformations that you wish to generate.
In the fields "Substructure #: Atom", type the identification number of one of the atoms directly coordinated to the lanthanide ion for substructure number #. Only one coordinated atom is necessary by substructure and, usually, substruture 1 is the lanthanide ion.
After downloading the script file, place it in the same folder of your lanthanide complex PDB file.
Open the PDB file in HyperChem and, in the menu bar, go to "Script" > "Open Script...".
A new window, called "Run Script", will open. Find the script file, which must be in the same folder as the one with the lanthanide complex file; and click on OK.
The random structures will be generated one-by-one. Please wait until this task ends.
Preparing the MOPAC input files
Now, run the input files in MOPAC2012. For this, first, please open all the MOPAC2012 input files, .zmt files, generated by the Tcl script. They will have a content similar to the one below:
  Name: test.ent
  MOPAC file created on 29/10 19:24:37 2010 by HYPERCHEM
Eu    00000.0000 0  00000.0000 0  00000.0000 0 0 0 0
O     00002.1936 1  00000.0000 0  00000.0000 0 1 0 0
H     00000.9905 1  00115.4357 1  00000.0000 0 2 1 0
H     00000.9899 1  00136.2327 1  00223.3732 1 2 1 3
O     00002.3615 1  00067.7104 1  00061.7306 1 1 2 3
O     00002.4246 1  00106.0711 1  00160.5103 1 1 2 4
Now, add the following keywords to the first line of each and every one of these files:
AM1 SPARKLE GNORM=0.25 BFGS CHARGE=+3
Warning: do not forget to include the correct total charge of your lanthanide complex by means of the keyword CHARGE, as indicate above.
The MOPAC2012 input files will now look like this:
AM1 SPARKLE GNORM=0.25 BFGS CHARGE=+3
  Name: test.ent
  MOPAC file created on 29/10 19:24:37 2010 by HYPERCHEM
Eu    00000.0000 0  00000.0000 0  00000.0000 0 0 0 0
O     00002.1936 1  00000.0000 0  00000.0000 0 1 0 0
H     00000.9905 1  00115.4357 1  00000.0000 0 2 1 0
H     00000.9899 1  00136.2327 1  00223.3732 1 2 1 3
O     00002.3615 1  00067.7104 1  00061.7306 1 1 2 3
O     00002.4246 1  00106.0711 1  00160.5103 1 1 2 4
Save and run these input files in MOPAC2012, one by one.
Finally, find the output file, generated by the calculations, which displays the optimized structure which has the lowest total energy. This structure will be your best candidate for a geometry global minimum.
If you are pleased with it, you can then use it for further calculations.